View incidents in the single-pane console
The Incidents Tab in BigPanda allows you to see all active incidents within your system, organized by statuses and environments. You can use the incident feed to view, filter, and take action on incidents. Further details about specific incidents can be found within the incident details pane.
By providing a single view into correlated, enriched incidents, the single-pane console provides the perfect starting point for AIOps teams. Easily visualize the overall health of the infrastructure, drill down into selected incidents and investigate probable root cause aided by AI / Machine Learning.
Next, teams can action incidents directly in the single-pane console, or if necessary, they can share and escalate through their integrated collaboration or notification tools.
Incident Feed
The incident feed provides a view of all active incidents from your integrated monitoring systems.
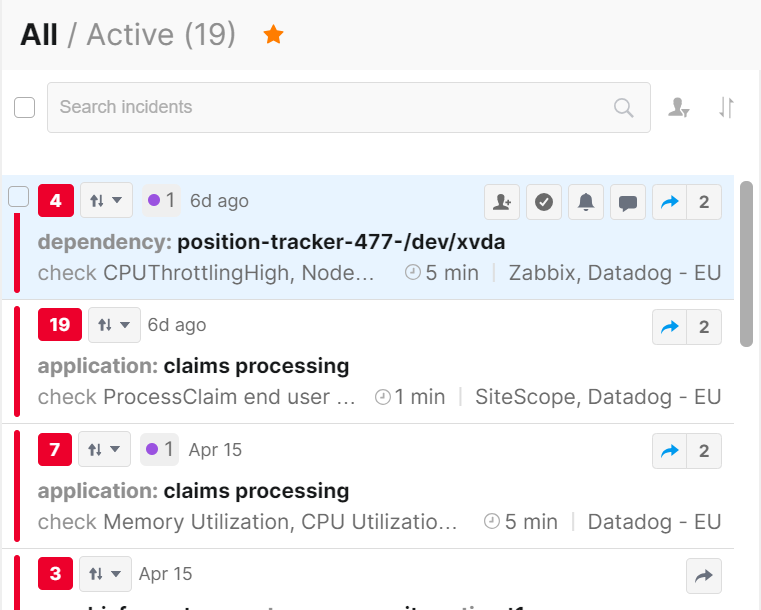
The Incident Feed
View the Incident Feed
BigPanda digests all the events from your integrated monitoring systems and intelligently correlates related events into incidents.
To view the incident feed:
At the top of the screen, click the Incidents tab.
By default, the incident feed displays all active incidents.
(Optional) In the left pane, select an Environment.
(Optional) In the left pane, select a folder.
Review basic information about each incident. For information about the fields that appear in the feed, see the Incident Feed documentation.
5. (Optional) Hover over a row to perform any of the available actions, such as Resolve, Snooze, Share, or Comment. See Triage Incidents and Remediate Incidents for more information.
The number of existing shares and comments are displayed for each incident. You can click either number to view relevant details.
Viewing incident details
To view more information, click the incident in the feed. The incident details appear in the right pane. You can view related alert details, a timeline of the incident life cycle, sharing history, comments, and more. For more information, see Incident Details.
Incident Feed Settings
To maximize performance, you are able to toggle the feed between Live updates and Manual updates.
Live updates updates the incident feed with new incidents, comments, and changed incident statuses automatically. Manual updates only updates the incident feed when you refresh your browser page, or when reopening the page after closing.
To change the feed setting, go to the Incidents tab, click Live updates at the top right of the console, and under Feed settings select Live updates or Manual updates.
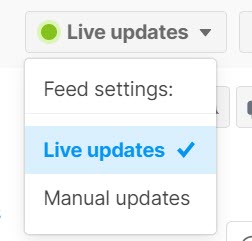
Live updates incident actions
If an incident becomes inactive while Live Updates are on, it will be removed from the incident feed.
If an incident is removed from the feed while you are in the process of sharing, resolving, or merging an incident, the action will not take place.
Incident Tags
Incident tags will appear on both the Incident Feed and in the Overview tab of the Incident Details pane.
Incident tags add key enrichment to your BigPanda incidents, helping you see key information about the event.
Information about the user who edited the tag, and the time and date of the change can be accessed by hovering over the name of the incident tag. Tags that have not been manually edited will show the last date and time that automatic incident enrichment occurred.
Users are able to manually assign or remove incident tags. To learn more about using incident tags with incidents, please see the Adding Incident Tags and Prioritizing Incidents documentation.
You are able to create, edit, or inactivate incident tags to fit the needs of your organization. To learn more about configuring incident tags, please see the Manage Incident Enrichment documentation.
Incident tags may also be configured to automatically add to specific incidents based on incident or alert criteria. To learn more about configuring automatic tags, please see the Automatic Incident Tags documentation.
Splitting and merging
If an incident has been manually split, the new incident will be created without any incident tag values. If incidents are manually merged, only the incident tags from the destination incident will appear on the merged incident. Source incident tags will not be added to the destination incident.
When an incident is resolved, the incident tags will remain tied to the incident for 18 months. If the incident is reopened, it will have all of the existing incident tags, with new ones added as the reopened incident develops.
Incident Tag Types
Incident tags may take the form of Priority, Text, or Multi-value tags.
Priority Tags
Priority tags create a hierarchy that can be sorted to mark in which order incidents should be addressed. Priority tags make it easier to view the importance and urgency of your incidents at a glance.

Priority Tag
By default, your environment will have Priority tags enabled, with pre-configured settings. These settings can be customized to better fit the needs of your organization. To learn more about customizing tags, please see the Manage Incident Enrichment documentation.
Priority tags are visible at the top left of incidents in both the feed and the details Overview tab, next to the incident severity. Incidents that have not been prioritized will display a grey icon with two arrows facing up and down.

Priority can be assigned from the incident feed or from the Overview tab of the incident details pane. To learn more about using priority tags, please see the Prioritize Incidents documentation
Text and Multi-Value Tags
Text and Multi-value tags add data sets with additional information, details, or other enrichment to your incidents. Each tag is made up of a customized value pair similar to BigPanda alert tags.
Configure text and multi-value tags such as affected environment or region to add context and enable better collaboration between your organization's teams.
Text and multi-value tags appear in the Incident tags section of the Overview tab in the incident details pane.
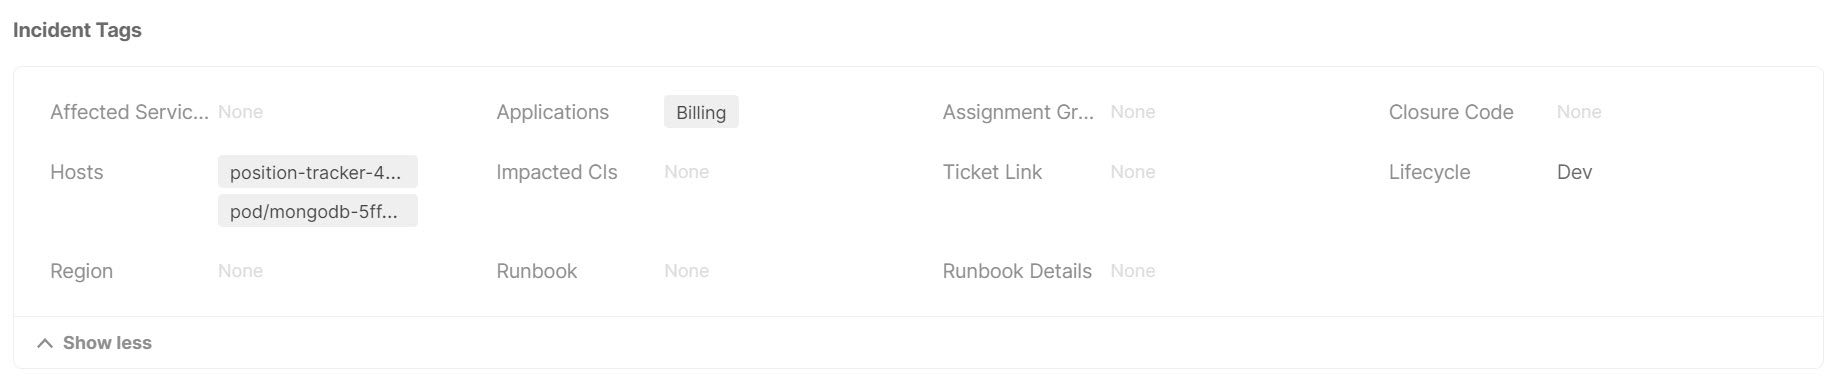
Text and Multi-value Tags
Each tag is made up of the name of the tag, and the tag value (e.g. Source_system: Nagios). For text tag types, the value is a single text string that appears in an editable text box. For multi-value tag types, the value is one or more individual text tags. These appear as individual items in the editable value field.
Once configured, text and multi-value tags can be assigned to incidents from the Overview tab of the incident details pane. To learn more about using text and multi-value tags, please see the Add Incident Tags documentation.
Select a Folder
A folder filters the incident feed by predefined criteria. You can select a folder to see all the incidents within an Environment that meet the folder criteria.
From the Incident tab, select an Environment in the left pane.
The incident feed shows the active incidents in the Environment, and the list of available folders expands.
In the left pane, select the folder with the desired criteria.
Folder | Criteria |
|---|---|
Active | Incident has active alerts and is not snoozed. |
Unhandled | Incident has active alerts and has not been shared or snoozed. |
Shared | Incident is active, and has been shared with users manually or by AutoShare. |
Snoozed | Incident is active, was snoozed, and is within the snooze period. When the snooze period elapses, the incident again appears in the Active folder and no longer appears in the Snoozed folder. |
Maintenance | Incident includes one or more alert that has been muted because of a Maintenance plan. Maintenance plans will only appear in your UI if they have been configured by an admin. See the Maintenance plans documentation for more information. |
Resolved (24h) | Incident was marked as resolved within the past 24 hours. When an incident is reopened, it again appears in the Active folder and no longer appears in the Resolved folder. |
Other | A custom environment folder can be configured by your administrator. The name and contents of this folder will be determined by your organization. |
Search for Incidents
You can search for incidents that meet specific criteria within the selected Environment and folder.
Regular expression support
Both keyword search and BPQL support regular expressions. Use a regular expression by entering a slash (/) as the first and last character of your search term. For example, /prod-.*-[0-9]+/. Regex queries are limited to 32,000 characters and are case sensitive. See Elasticsearch Regular Expression Syntax and BPQL for more regex support.
At the top of the incident feed, enter a keyword search term, an exact phrase in quotes keyword search, or a query in BigPanda Query Language.
Click the search icon or press Enter.
(Optional) Scroll down to view more results.
Search logic and results
Enter a term or an exact phrase in quotes to perform a keyword search of the incidents in the selected Environment and folder. The search finds alerts with matching values in descriptions, source systems, and in any standard or custom tag (such as host, check, or status).
Use BPQL to search for values in a specific alert tag or to create an advanced query. You can search any standard or custom tags, define precise conditions with operators, and include multiple conditions.
Search with incident tags
Incident tags and some incident metadata can be used to search and filter incidents. Standard incident tags that can be searched include source_system, status, assignee, assigner, severity, zero_impact, is_active, comment. See the Tag Naming documentation for a list of system limitations tied to specific tags.
When searching or defining BPQL conditions using incident tags, you must use the Incident Tag ID, not the incident tag name.
To see the incident tag ID, click an incident tag name in Query Assist. The tag ID is then populated in the search bar or input field. You can also find the Incident Tag ID on the Settings > Incident Enrichment screen in the incident tag details pane.
To search using an incident tag, the tag ID must be preceded by incident. (For example, incident.runbook)
Filter by Assignee and Sort Incidents
The feed lists incidents that meet the current environment folder and search criteria. By default, the incidents are listed in order by when they were last changed, with the most recently changed incident on top. You can filter by assignee or change the sort order of the incidents in your feed.
Filter
The filter by Assignee option can be used to filter the incident feed by the incident assignee. Filter by your own name to get a clear picture of incidents you are responsible for, or by another team member's name to see their workload.
To filter the feed:
From the incident feed, click the Assignee icon, the second icon to the right of the search field.
Search for or select an assignee from the list.
To remove the filter, click the Filter by Assignee icon again and select Clear filter.
Filtering by assignee
You can only search the filter one name at a time.
Filter by email
You can also filter the incident feed using an assignee’s email address. In the Search Incidents text box, enter assignee = <user's email address>.
Sort
To change the sort order of the incident feed:
From the incident feed, click the Sort by icon, the third icon to the right of the search field.
Select the desired sort order.
Item | Description |
|---|---|
Last changed (Default) | Time that the incident was last changed (most recently changed on top). A change includes status changes on related alerts and the addition of new alerts to the incident. |
Priority | Assigned level of importance (most important on top). Incidents that do not have a priority assigned will be listed at the bottom by Last Changed. |
Status | Current status of the incident (most severe status on top, in the order: |
Created | Time the first alert on the incident was received (newest on top). The order is preserved even if the status of an incident changes. |
No. of Alerts | Number of active alerts (highest number on top). Secondary sorting is based on Last Changed. In the Resolved folder only, the number of alerts is the total number of alerts, as no alerts are active on a resolved incident. |
Duration | Amount of time that the incident has been open (longest on top). Secondary sorting is based on Last Changed. |
Filter the Incident Feed using environments
Environments function as global filters for the incidents in the Incidents tab.
On the left of the Incident tab is the Environments pane. All available environments are listed, with the current Environment highlighted and expanded.
To change which environment you are viewing, select the desired environment’s name from the list. The Incident Feed will update to show only incidents that are grouped into that environment.
Each environment is pre-sorted into status folders: Active, Unhandled, Shared, Snoozed, Maintenance, and Resolved (24h). Incidents that fit the environment rules will be automatically placed in their respective status folder(s). When selecting an environment, the Active folder will open first. To move to a different folder, select the folder name from the Environments pane.
Folders
Incidents will appear in all relevant folders. An incident that has been shared and snoozed will appear in both folders. Resolving an incident will move it to the Resolved folder and remove it from other folders.
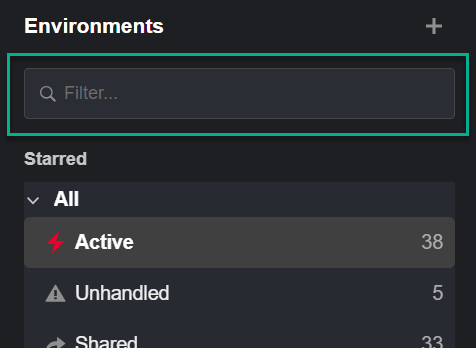
At the top of the Environments pane, a search bar allows you to filter environments. For organizations with numerous environments, use the filter feature to quickly isolate a particular environment.
To filter the Environments pane, begin typing the environment name into the Filter search bar. Matching results will appear in real-time.
Clearing the filter search bar will revert the list and show all environments.
You can sort the list of environments Alphabetically or by Creation date. To sort the list, navigate to the upper right corner of the Environments pane and click the Sort button.
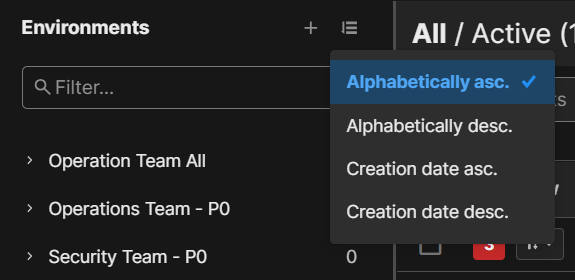
Starring environments
Each user can Star environments, saving them to a Starred group at the top of the Environments pane. Click the Star beside an environment name, or the Star option in the three dots dropdown to save it for easy access.
Filter Environments
Respond to Incidents
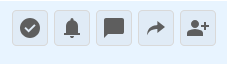
You can respond to incidents within the Incident feed using the incident action icons.
Incident Actions
Take action using the prioritize, assign, resolve, snooze, comment, or share icons on each incident, or use the selection boxes to take action on multiple incidents at once. Click any incident in the incident feed to open the incident details in the incident pane.
Detailed Actions
Some incident actions can only be performed from the Incident Details pane. To download incident details, split the incident, adjust incident tags, leverage AI summaries, and more, navigate to the Incident Details pane.
To learn more about taking action on incidents, see the Triage Incidents and Remediate Incidents documentation.
Incident Details
The Incident Details pane shows in-depth information about an incident and the actions available for it. To open the pane, select an incident in the Incident Feed. The pane opens on the right side of the screen.
Warning
The AI Triage tab is available only to organizations where it has been enabled. Without it, AI results appear in a side panel. To enable the tab, contact your BigPanda account team.
The pane is organized into tabs by type of incident data:
Tab name | Details |
|---|---|
Shows the most important information about the incident at a glance: the AI Triage card, AI analysis, incident tags, active alerts, potential root cause changes, and recent activity. The Overview tab opens by default. | |
Shows the AI triage results for the incident in collapsible sections. Each section shows its status on the right. | |
Shows the alerts in the incident, including alert links, related changes, and flapping alerts. To split the incident, use this tab. To see more details about an alert, click it in the table. Your BigPanda administrator controls which details appear. See Manage Alert Views. | |
Shows the Topology graph for the incident, a customizable display of the links between the incident's alert tags (nodes). | |
Shows change data related to the incident. BigPanda correlates changes with the incident and suggests the ones that may have caused it. A highly correlated change appears at the top of the change table and in the Overview tab as a potential root cause change. | |
Service Desk | Shows service desk tickets correlated with the incident. To check for matching tickets again, click Rerun correlation. |
Shows past incidents that are similar to the selected incident. Use them to understand recurring issues and decide on next steps. | |
Correlation | Shows the correlation graph for the incident: the current incident, its correlated incidents, and the relationships between them. |
Shows the activity in the incident: comments, previous incident actions, and status changes such as flapping, resolving, reopening, and auto-resolution. To add a comment, use this tab. |
The information on each tab depends on the data sent to BigPanda. Not every incident has information on every tab.
URL format
Alerts and tags can include URLs with or without a suffix. For example, both https://bigpanda.io and https://bigpanda are valid URLs.
Overview tab
Incident Overview tab
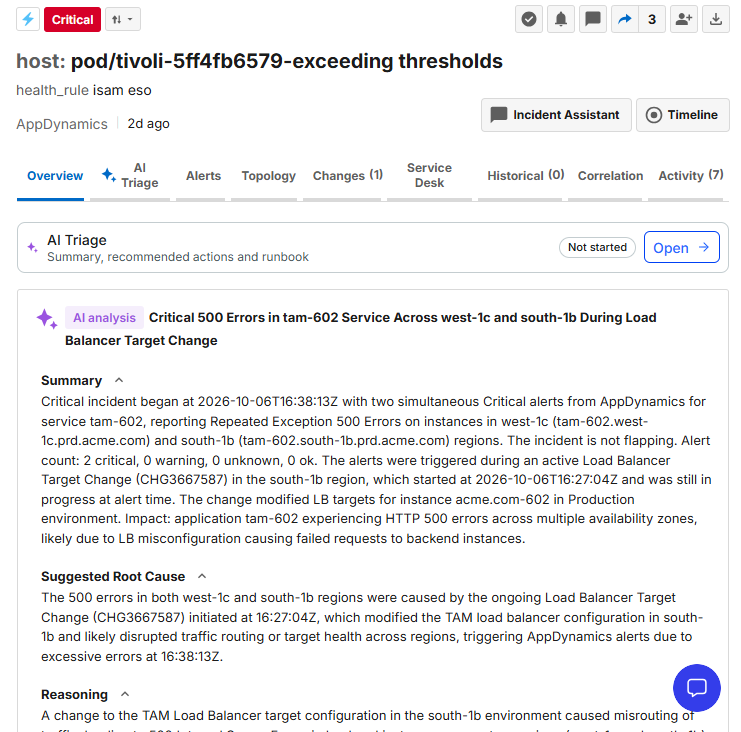
The Overview tab shows these sections, from top to bottom:
AI Triage: The current triage status, for example "Not started". To open the AI Triage tab, click Open.
AI analysis: An AI-generated title, Summary, Suggested Root Cause, and Reasoning. To copy the analysis, click Copy. To generate a new one, click Regenerate. To rate it, click the thumbs up or thumbs down icon.
Incident tags: The incident's tags and their values. To change them, click Edit. To see all tags, click Show more.
Active alerts: The active alerts in the incident. To open the Alerts tab, click View all. To act on selected alerts, click Split or Resolve.
Potential root cause changes: Changes that may have caused the incident, with their status, key, summary, start time, root cause, and score. To open the Changes tab, click Investigate changes.
Recent activity: The latest actions on the incident. To open the Activity tab, click View all.
AI Triage tab
AI Triage tab
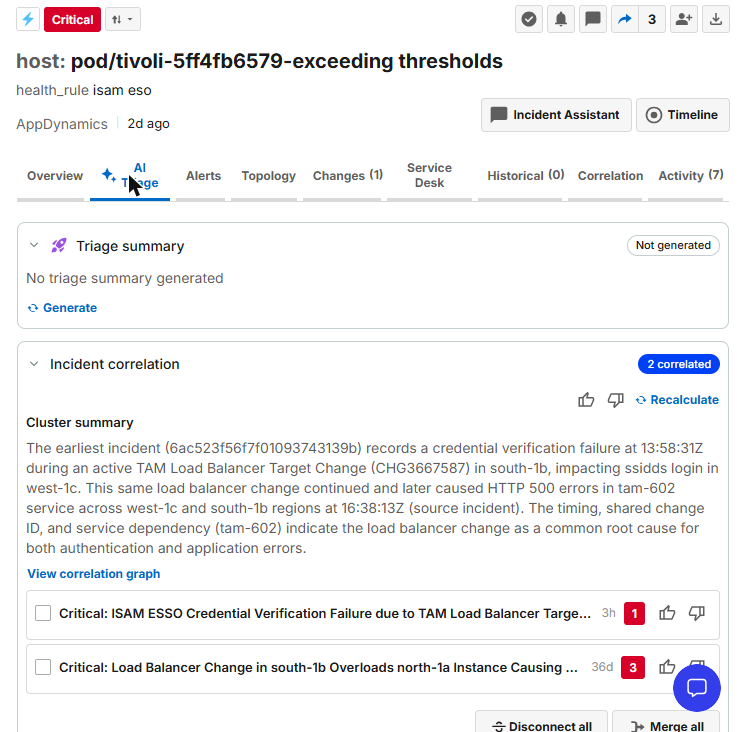
The AI Triage tab groups the AI triage results for the incident into collapsible sections. Each section shows its status on the right. To expand or collapse a section, click its header.
Section | Details |
|---|---|
Triage summary | An AI-generated triage summary of the incident. Until a summary is generated, the status shows "Not generated". To generate one, click Generate. |
Incident correlation | Incidents that BigPanda has correlated with this incident. The status shows "Checking" while correlation runs, then the number of correlated incidents. The section starts with a Cluster summary that explains why the incidents are related, followed by the list of correlated incidents. Each correlated incident has its own explanation. |
Work with correlated incidents
In the Incident Details pane, click the AI Triage tab, or click Open on the AI Triage card in the Overview tab.
Expand Incident correlation and review the Cluster summary.
(Optional) To open the graph in the Correlation tab, click View correlation graph.
For each correlated incident, click the thumbs up or thumbs down icon to rate whether the correlation is accurate.
Click Merge all to merge the correlated incidents into this incident, or Disconnect all to remove the correlation.
(Optional) To run correlation again, click Recalculate.
Correlation tab
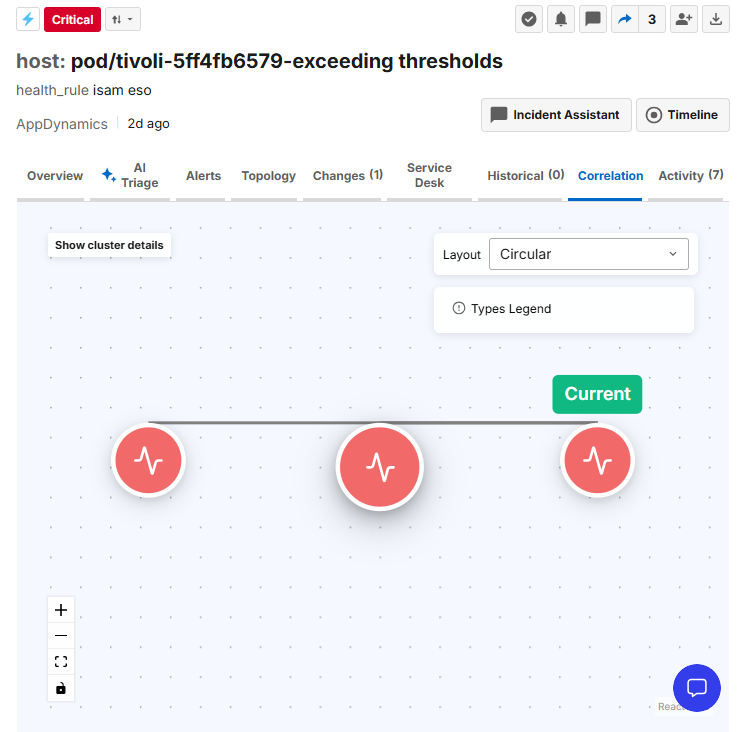
Correlation graph
The Correlation tab shows the current incident and its correlated incidents as a graph. To change how the graph is arranged, select a layout from the Layout dropdown. To see what each relationship type means, open Types Legend.
When the tab opens, the Cluster Overview panel opens on the right. To reopen it after closing it, click Show cluster details. The panel shows:
Total incidents, number of relationships, average confidence, and the time the analysis was generated
Affected layers, for example Application
A summary of the cluster
The number of relationships of each type: Source Caused Target, Target Caused Source, Bidirectional Cause, Common External Cause, Recurrence, and General
The incidents in the cluster
To run the correlation analysis again, click Rerun analysis.
Incident ID
Each BigPanda incident is automatically assigned a unique incident ID. Incident IDs are used to:
Query using BigPanda APIs
Link directly to a specific incident
Preview Automated Incident Analysis configurations
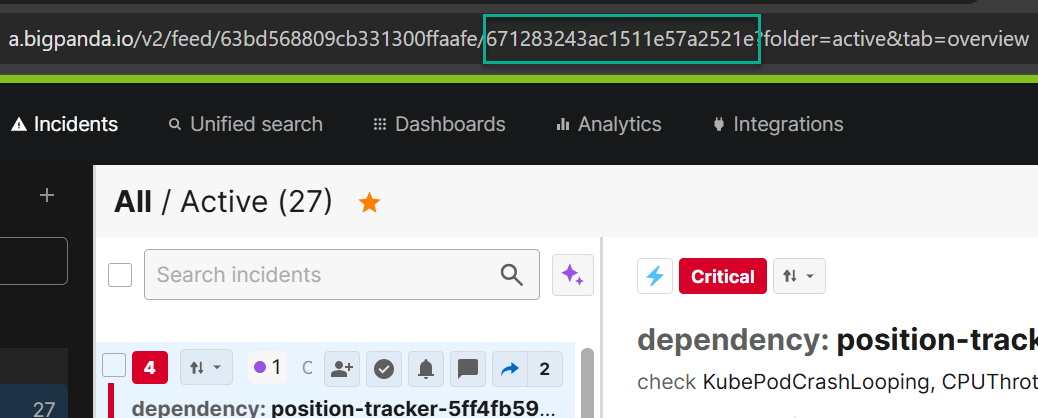
To copy the incident ID, hover over the incident title and click the copy icon. You can also find the incident ID in the BigPanda URL.
Customize Incident Layouts
You can customize how incidents appear on the screen by choosing a list, split, or table pane layout.
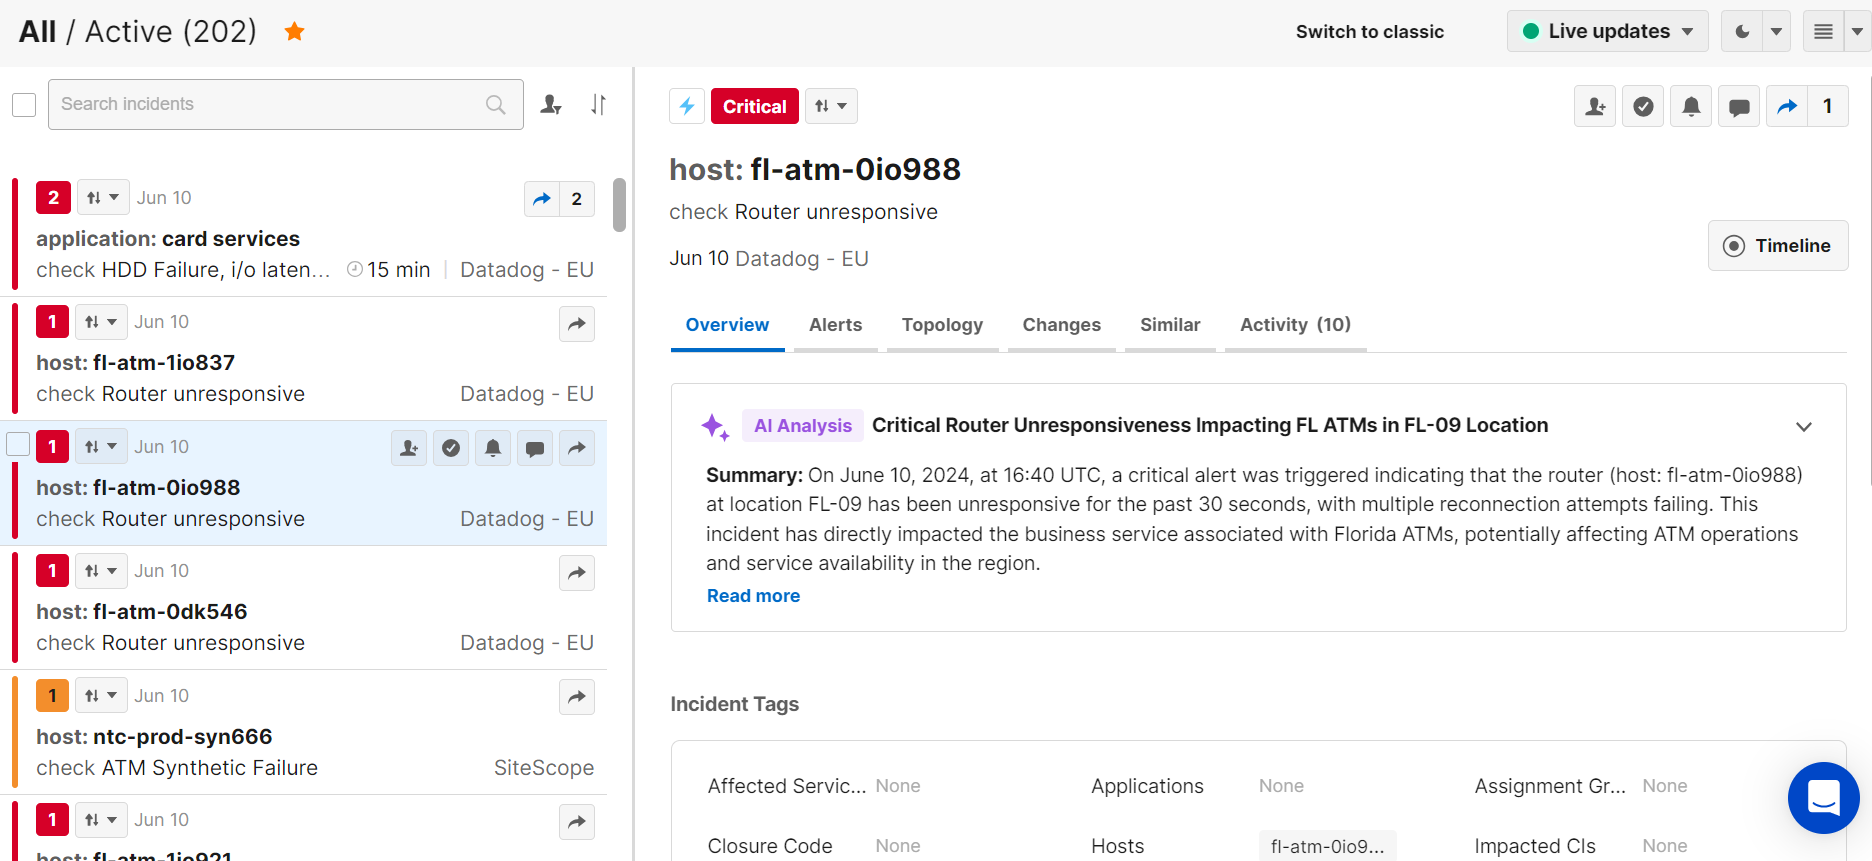
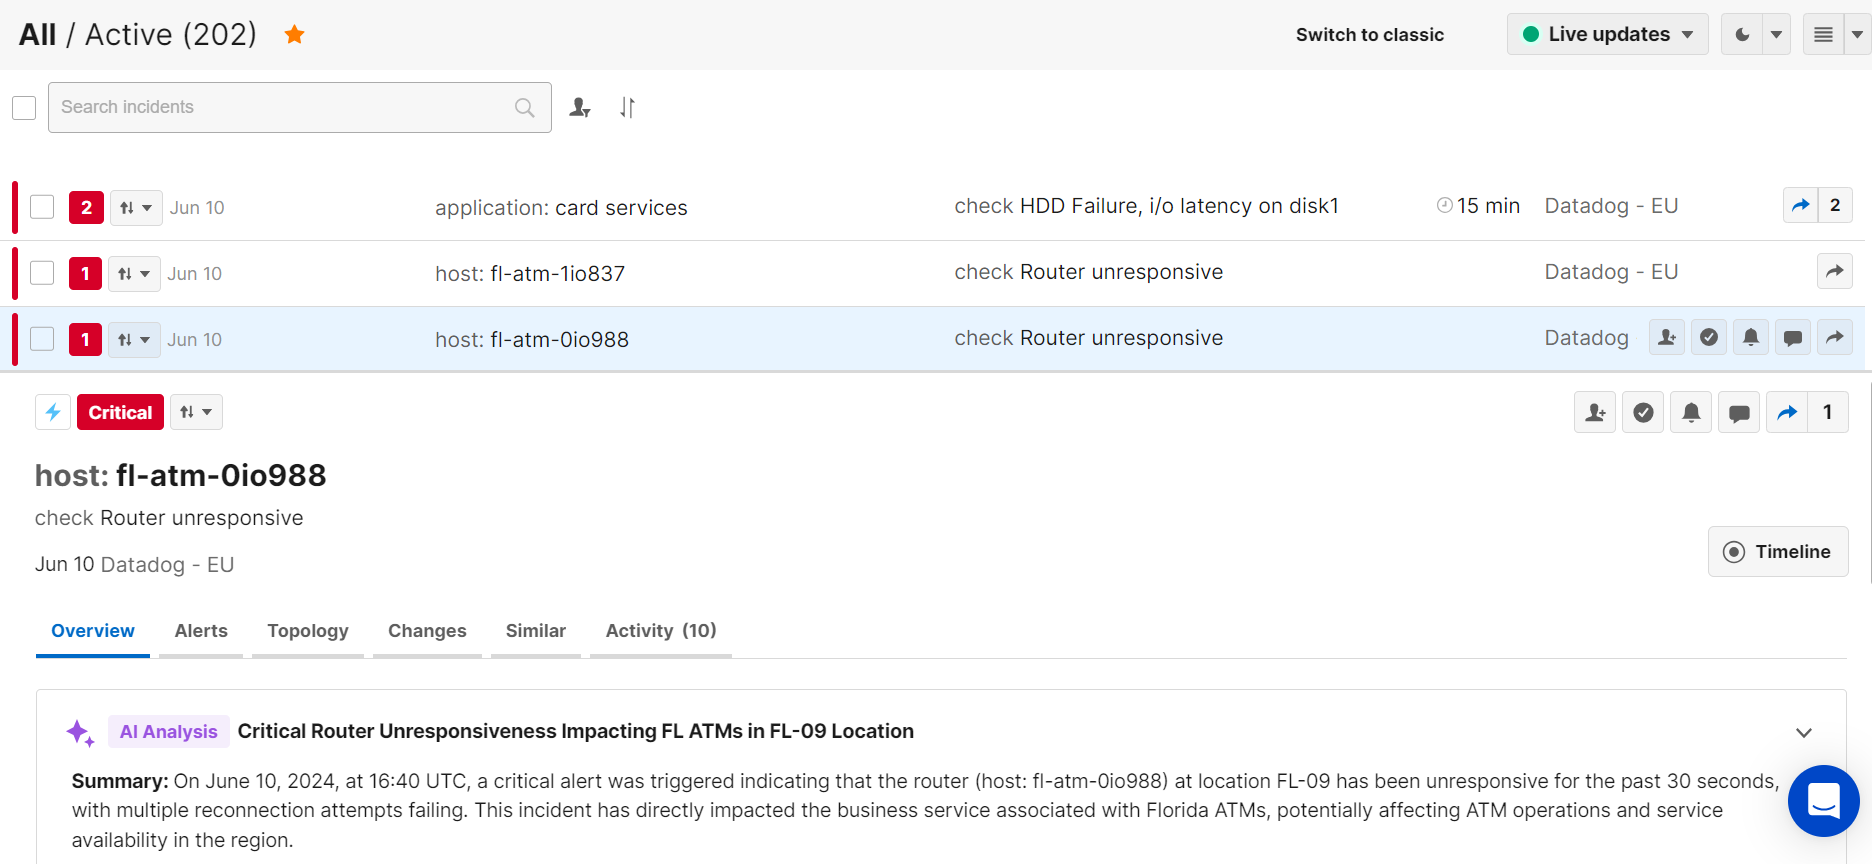
When the List layout is selected, the details pane appears to the right of the feed. The Split layout places the details pane below the incident feed. The table layout displays the incident feed without the details pane.
The default view is List, but once you’ve changed the setting, BigPanda will remember your selection.
List Pane
Split Pane
When the Table view is selected, the incident feed view appears without the details pane by default.
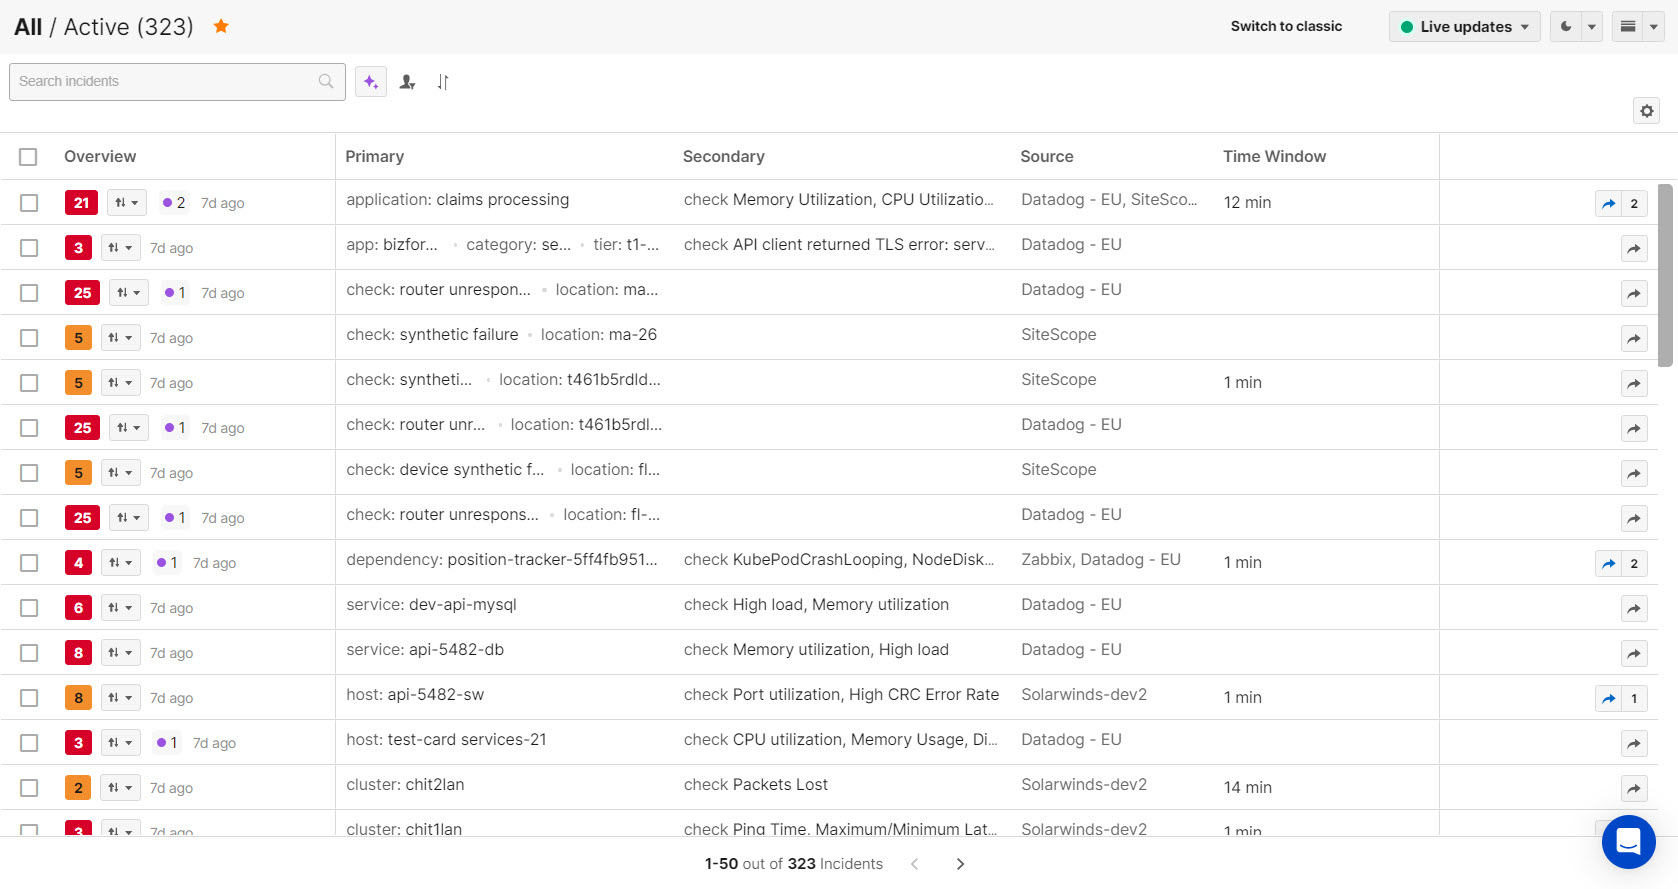
Table Option
To change the layout, click the arrow next to the layout icon at the top right of the console, and under Feed layout select List, Table, or Split. When this layout is selected, the incident feed ribbon will fill the entire incident console. You can drag the edges of each column to adjust the size.
To view incident details, click an incident in the feed and the details will appear in a flyout pane on the right. Click Open full page to open the incident on its own page, or click X to close the flyout.
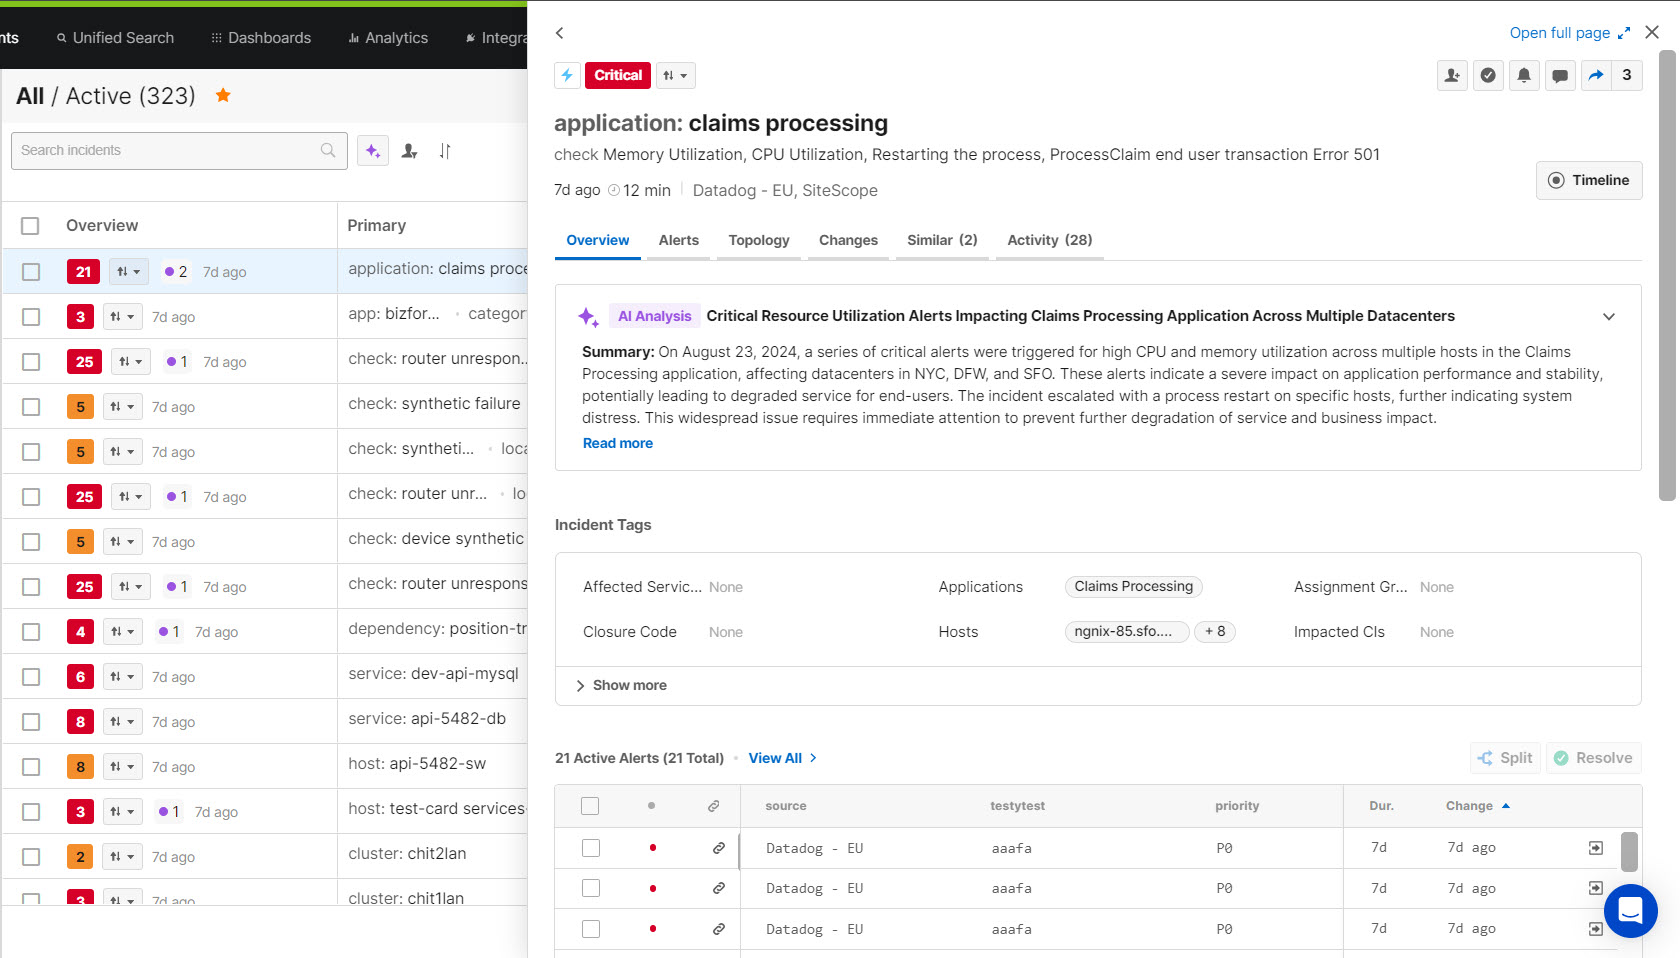
Details Pane
Incident Feed View Customization
With Incident Feed Views, you can customize the tags that appear when the Table layout is selected so that the information most relevant to you is always available at a glance.
Incident Feed Views are based on environments, so you can create separate views for different teams working in BigPanda. All users who have access to an environment will see the same customized table view.
See the Manage Incident Feed Views documentation for more information.
Mobile Support
In the lightning-fast world of ITOps, it’s vital to be able to respond to outages no matter where you are. The BigPanda Incident Feed is mobile-compatible, allowing you to find and view incidents, dig into their details, and take action even on the go.
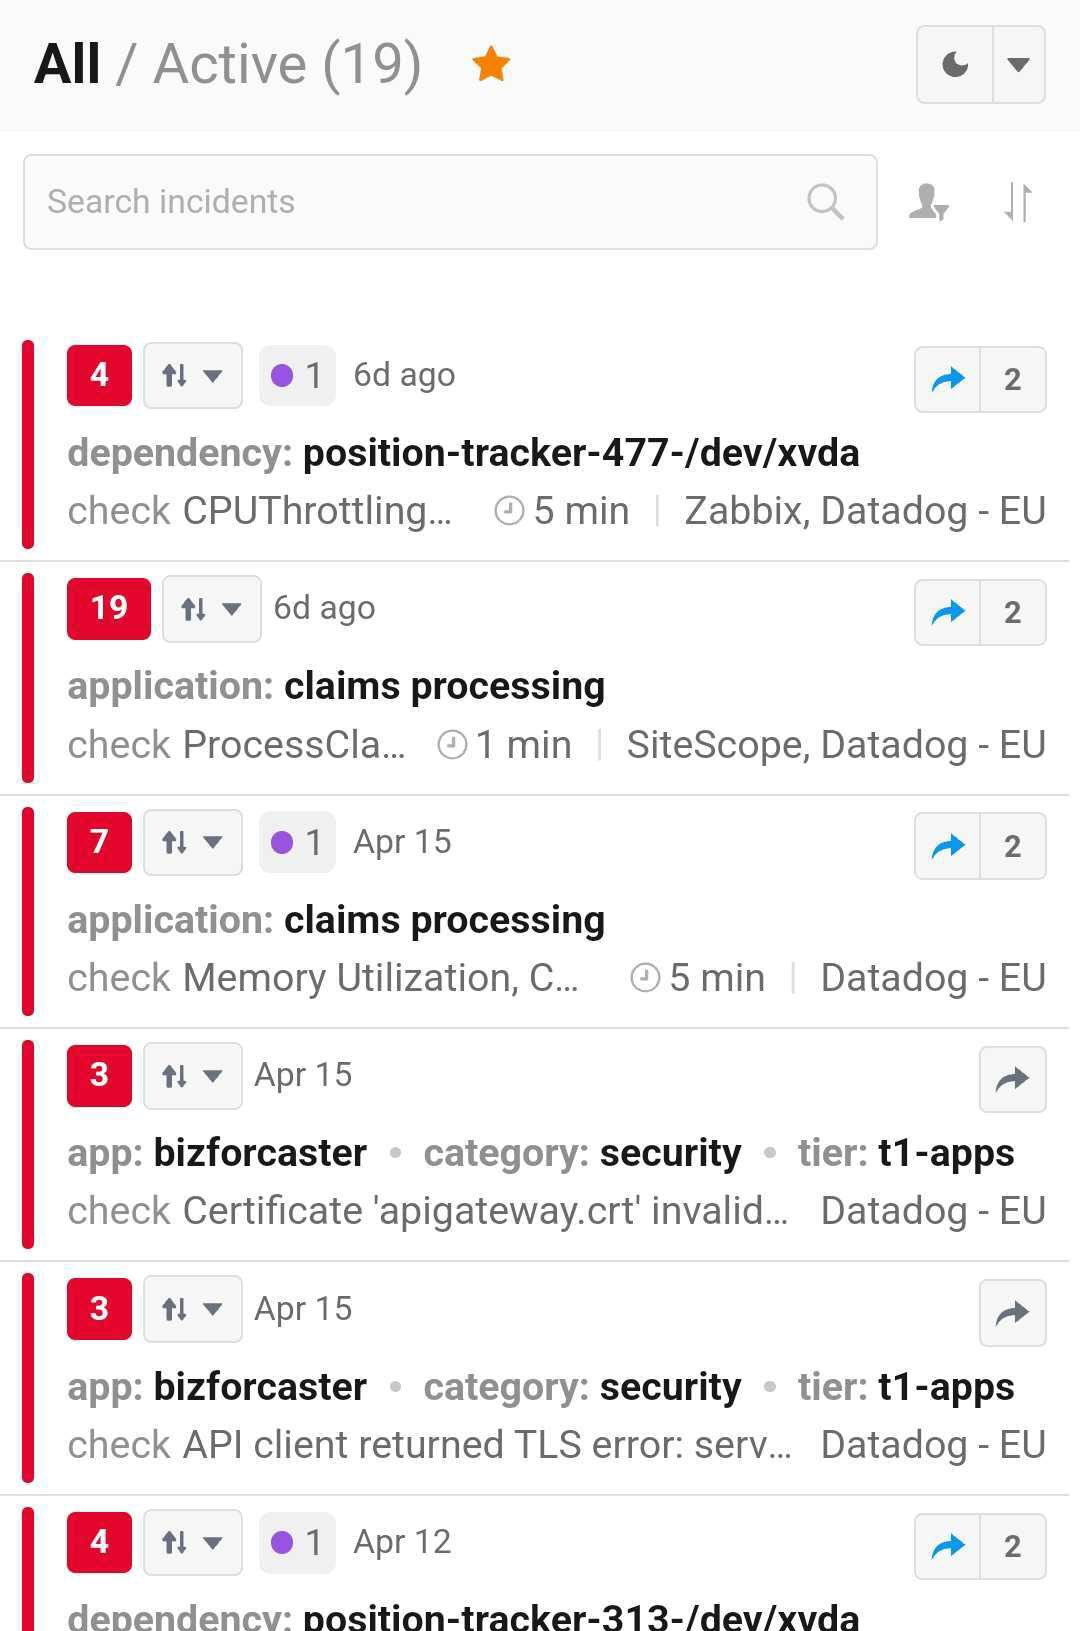
Mobile Incident Feed
BigPanda mobile works on any device capable of running a Supported browser.
Use BigPanda Mobile
To optimize the interface for mobile screens, the BigPanda Mobile Incident Feed is streamlined and simplified.
By default, the BigPanda mobile screen will open your view on the All Incidents/Active environment folder. To change the environment or folder, select the three lines icon in the top left of the page, and select the environment or folder from the flyout list. Filter environments at the top of the flyout by entering a term or an exact phrase in quotes.
To maximize performance, you are able to toggle the feed between Live and Manual Updates. Live Updates update the incident feed with new incidents, comments, and changed incident statuses automatically. Manual Updates will only update the incident feed when you refresh your browser page, or when reopening the page after closing. To change to a different feed setting, select the Settings wheel and click the desired frequency.
Select an incident to open the Incident Details page. From the Incident Details page, you are able to take action on the incident, or delve into alert details, timeline, and potentially related changes. To learn more about the incident details pane, see the Incidents Tab documentation.
To return to the incident feed, click the back button on your mobile browser.
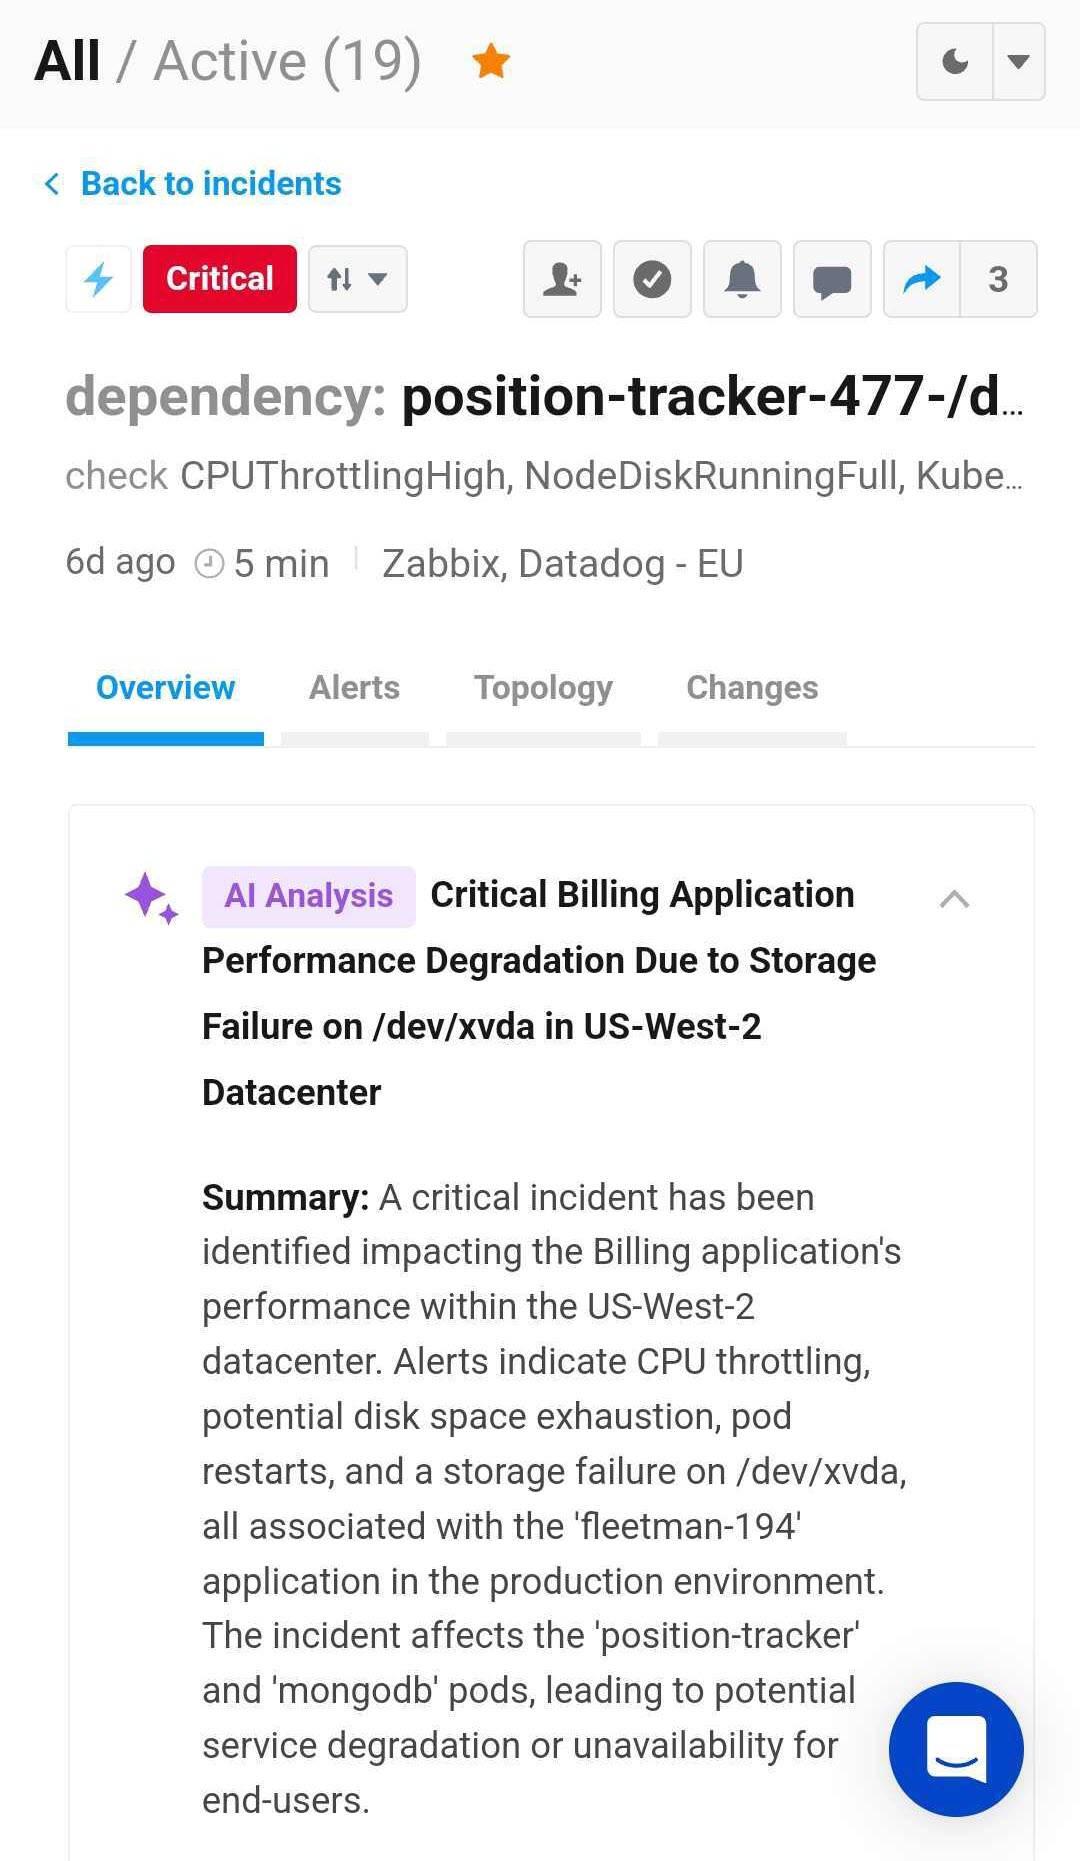
Mobile Incident Details
Incident preview
When opening an incident preview on a mobile device, it will open automatically in the BigPanda mobile incident details view.
See Incident Previews for more information.
Incident search is available in the Mobile Incident Feed using both keyword and formula queries. To search the incident feed, click the magnifying glass icon at the top right, and enter your query in the field that appears.
Incident information is condensed within the mobile view to maximize the visibility of key information such as priority, assignment, severity, and action status. To view a full incident title, description, or tag, click the shortened text and a tooltip will appear with the full text.
Incident actions
You can take action on incidents using the Mobile Incident Feed. Click the icon for the action you would like to take and the action dialog box will open.
To learn more about incident actions, see the Triage Incidents and Remediate Incidents documentation.